Monitoring
Tools
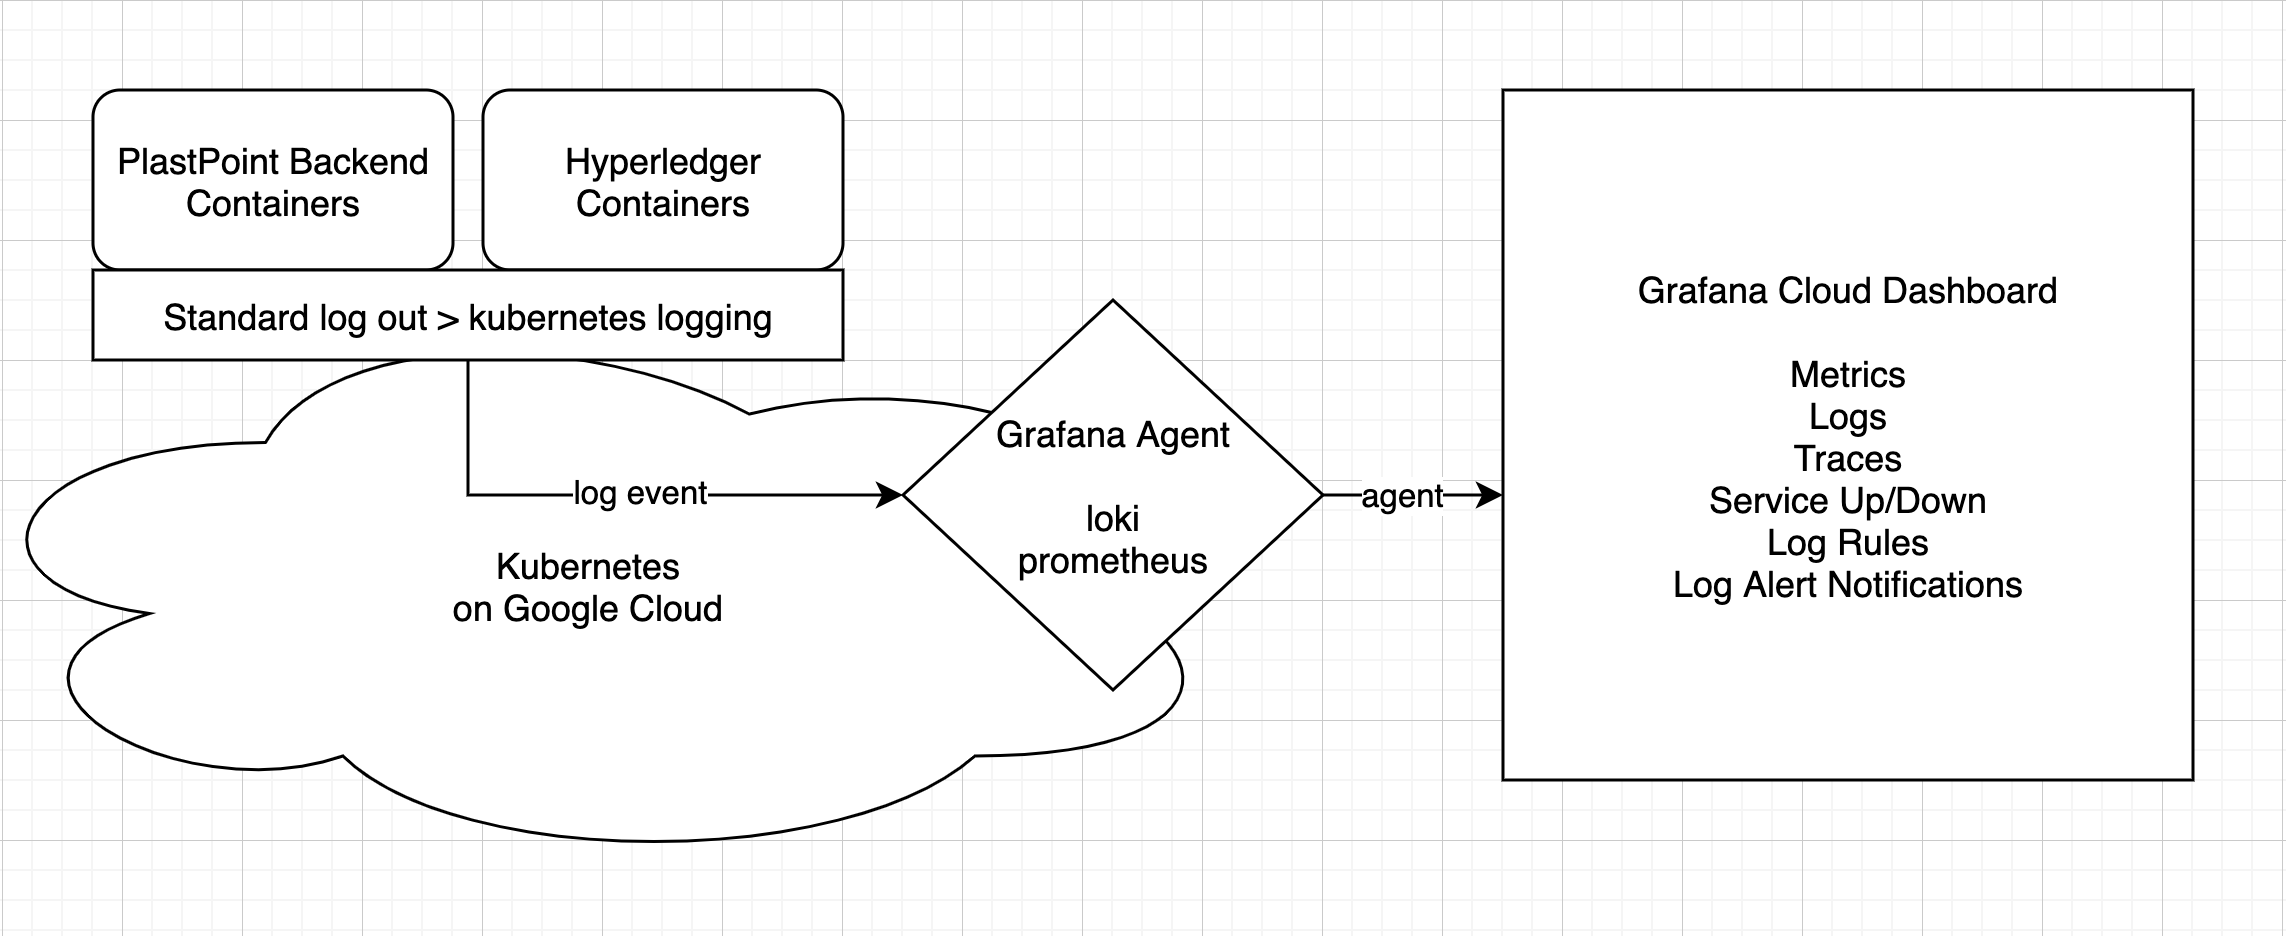
- Standard Log Out in Kubernetes
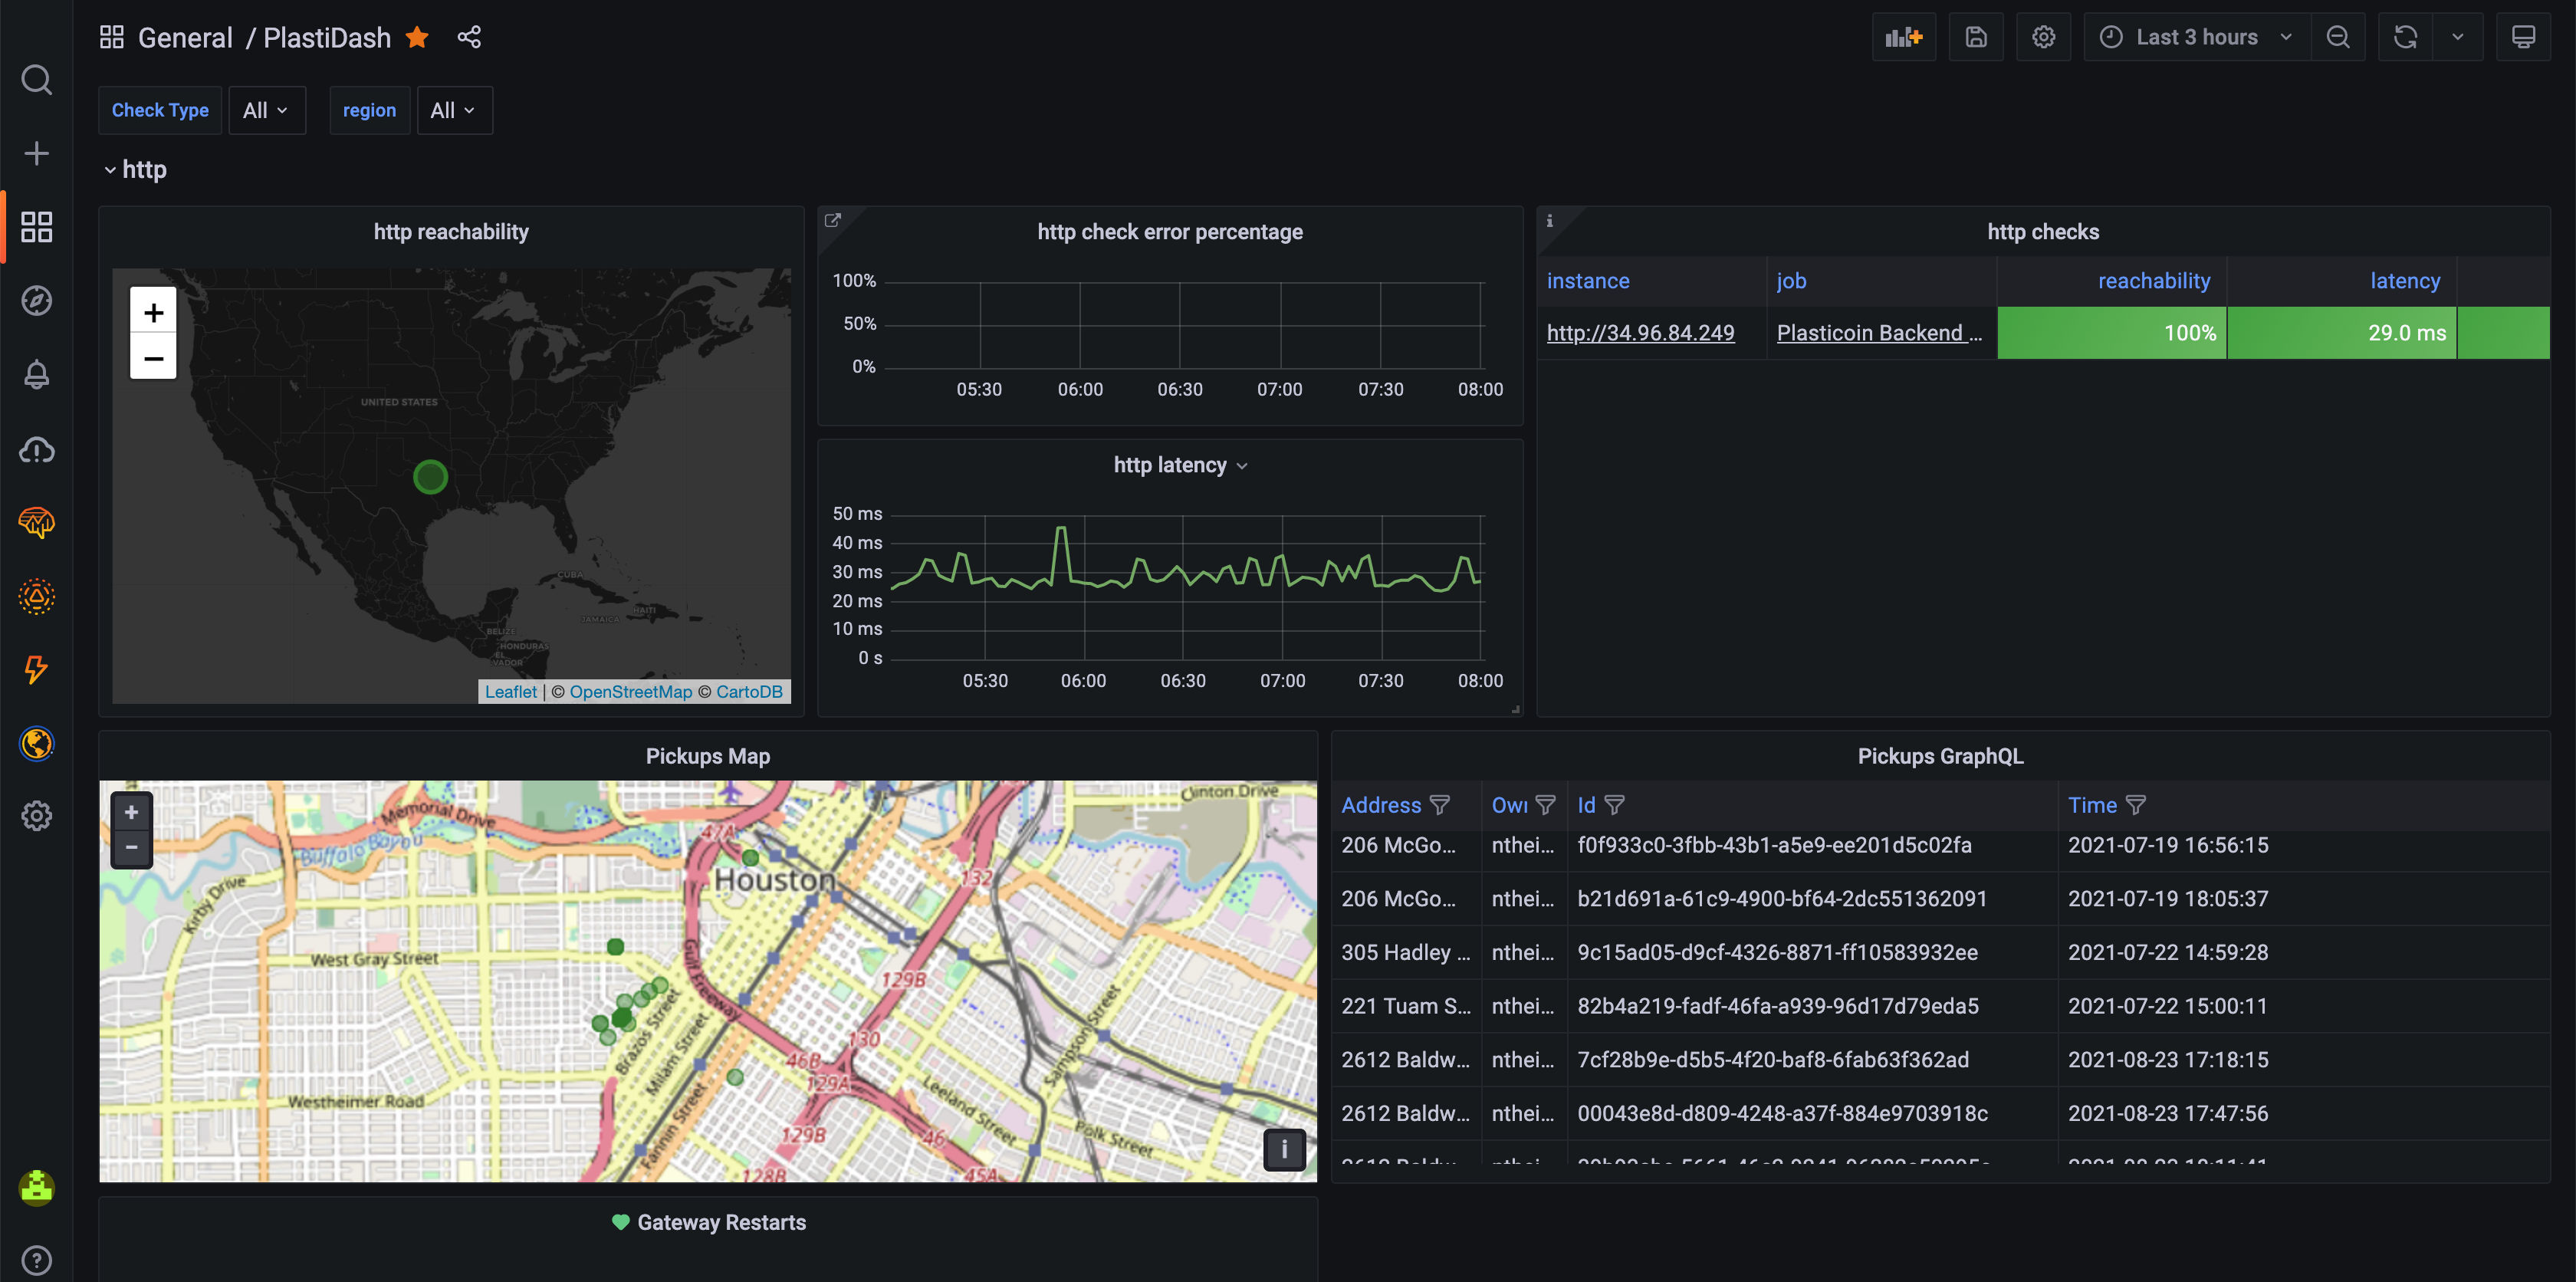
- Grafana Cloud Dashboard
- Loki and Prometheus
Architecture

Grafana Dashboard Url
https://plasticoinapp.grafana.net/d/fU-WBSqWz/plastidash?orgId=1&refresh=10s

Docs
https://grafana.com/go/webinar/guide-grafana-cloud-exploring-kubernetes-metrics-and-logs/
Install agent
- Kubernetes Integration install via https://plasticoinapp.grafana.net/a/grafana-easystart-app/?page=integrations-management
- Configure
- Restart
1
kubectl rollout restart deployment/grafana-agent
- Configure Kubernetes Workload Logging (Loki Agent) https://grafana.com/docs/grafana-cloud/quickstart/agent-k8s/k8s_agent_logs/
- Explore logs and metrics
1
https://plasticoinapp.grafana.net/goto/9ftOSQK7k?orgId=1
- Loki Query to search the plasticoin node app for a log that contains the word “gateway”
1
{app="node"} |= "gateway" - Setup alert rules
https://www.youtube.com/watch?v=GdgX46KwKqo
1
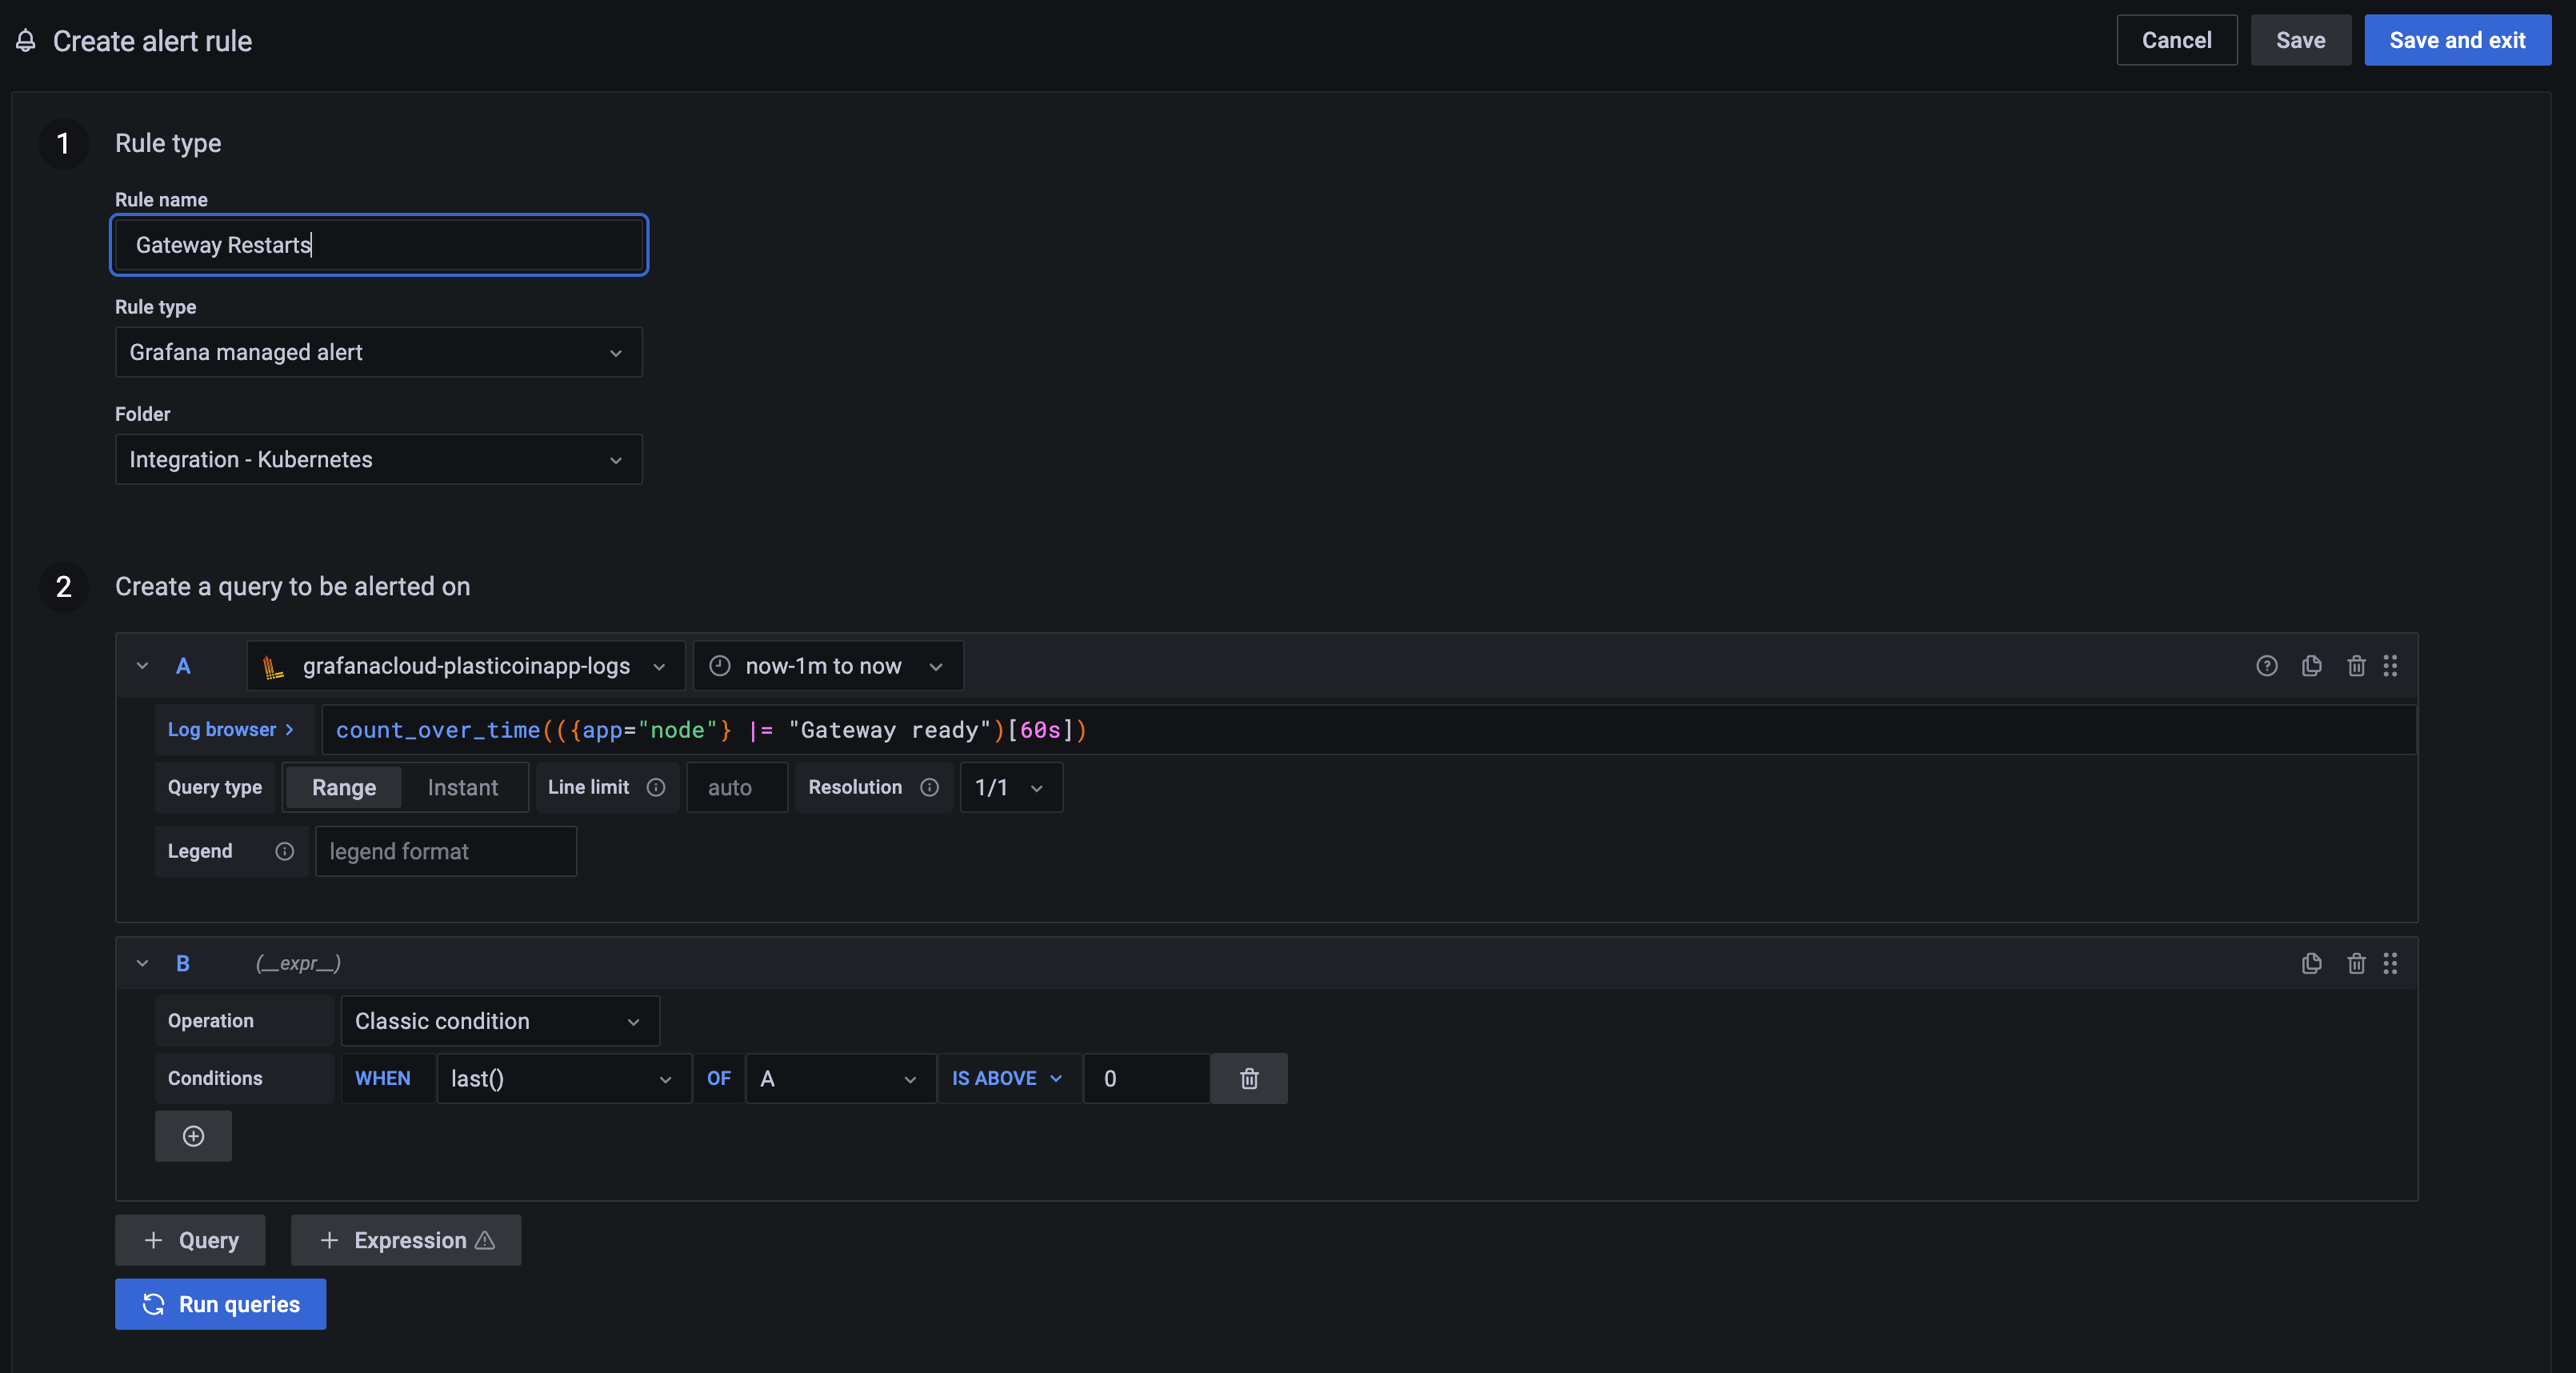
count_over_time(({app="node"} |= "Gateway ready")[60s])
Alerting
How to create an alert for a log?
- The example below monitors the kubernetes workload logs (std console log out) and it searches for the app named
node, which is our Plasticoin Backend. - It then searches for a log entry that containers the text
Gateway ready. - It counts how many times the log appears over 60 seconds
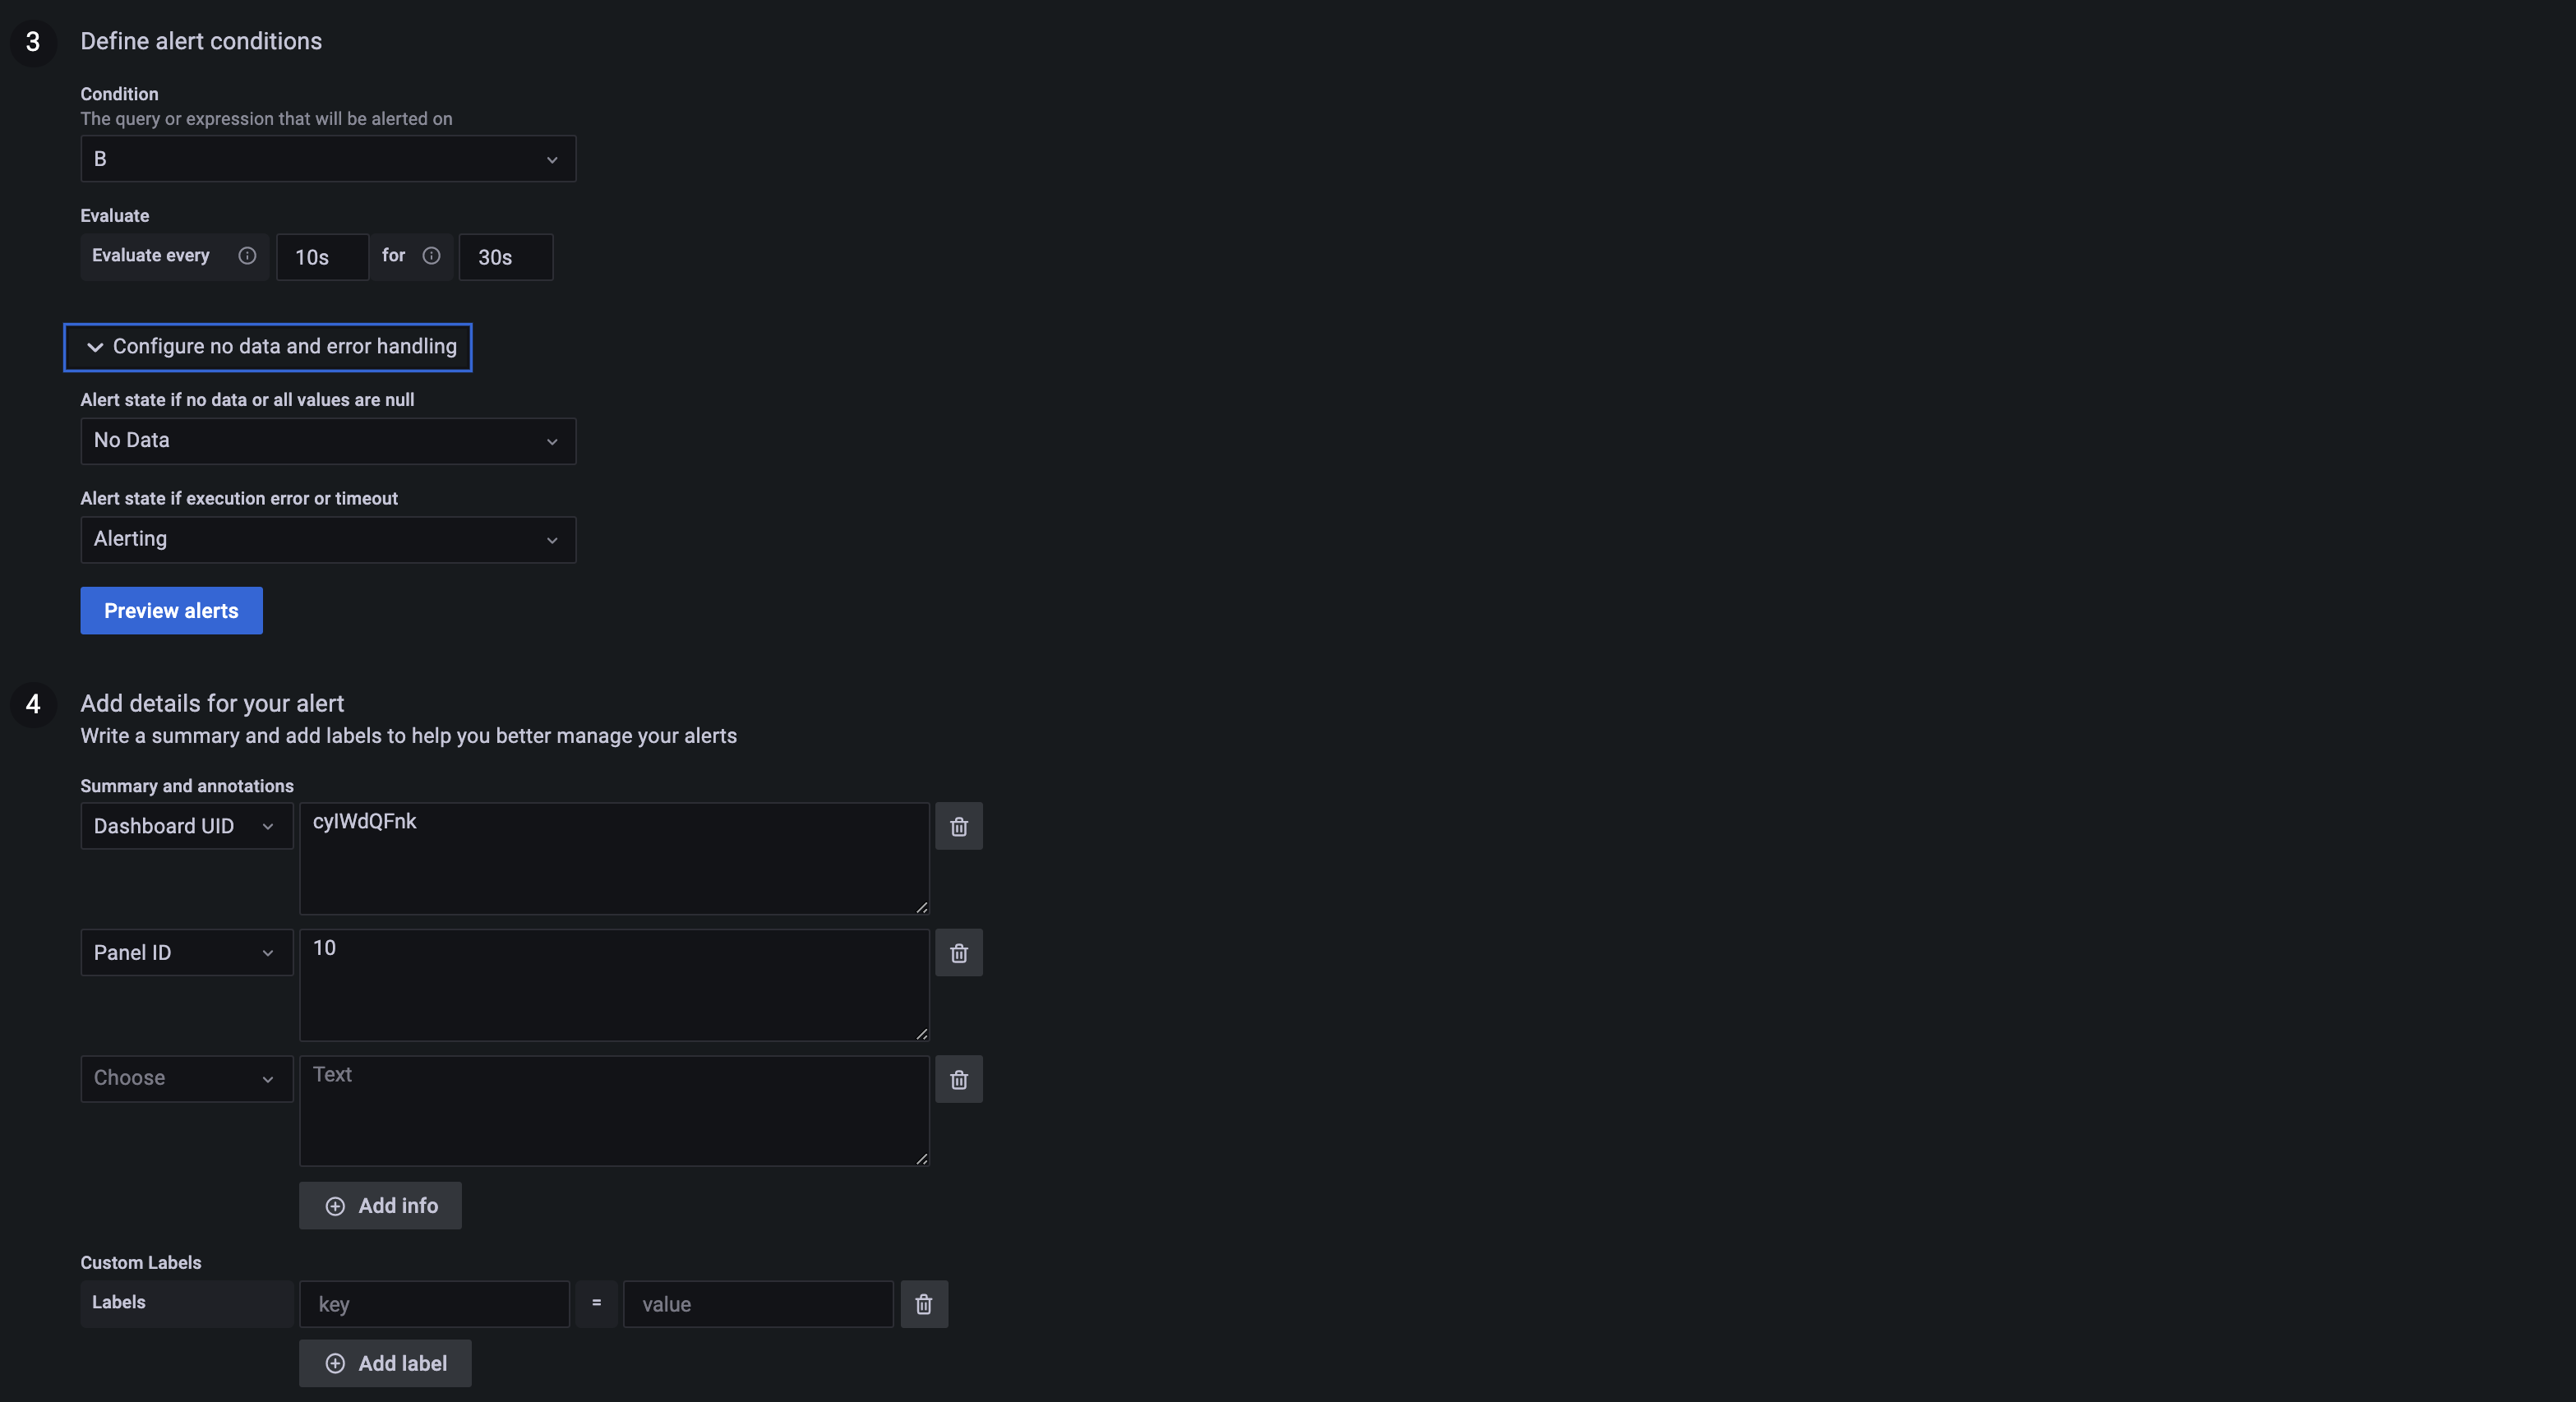
- After 60 seconds if the count of the log entry is larger then 0 it changes the state to a
pendingalert - If the log is pending for over 30 seconds then it changes the state to
firing - An email should be sent based on the notification policy (currently it emails plasticoinapp@gmail.com)


How to export all the alerting rules? Open devtools and paste the following in the console:
1
2
3
4
5
6
7
8
(async () => {
    function sleep(ms) {
        return new Promise(resolve => setTimeout(resolve, ms));
    }
    const resp = await fetch(`api/ruler/grafana/api/v1/rules/`);
    console.log(resp.json)
}
)();